Explore thousands of data visualisation projects and get inspired

Any topic SQL Python R Machine learning Data visualisation
Project photo

Covid-19 Data Exploration

The aim of this project is to create a interactive dashboard to visualize the Covid-19 numbers across the world regards infections, deaths and vaccinations. Although it is a simple project, the purpose was to get familiar with SQL queries and Tableau software.
Thiago Pauli
Project photo

WR Predictor

A web app allowing you to predict the best possible time for a game speedrun.
Charles-Meldhine Madi Mnemoi
Project photo

Lyrics Explorer

A web app allowing you to explore statistics and charts about French Hip-Hop lyrics.
Charles-Meldhine Madi Mnemoi
Project photo

Music Database Data Pipeline PoC

A proof of concept of a complete data pipeline generating real-time dashboards from a music store database.
Charles-Meldhine Madi Mnemoi
Project photo

STUDENT ENGAGEMENT DASHBOARD

A project under 365DataScience data challenge. Manipulate data pre-processing and validation with MySQL, Perform data import and modelling and Create specific measures using DAX expressions.
Dinh-Duc Tran
Project photo

Data Science Jobs Monitoring

This project is a system that utilizes web scraping to collect job descriptions for data science positions from Indeed.com on a daily basis. The system then analyses the collected data and displays the most in-demand technologies for data science in the form of interactive visuals.
Abdessamad. BAAHMED
Project photo

Analysis of US January Air traffic

Project whose objective was to bring light to air traffic trends in the US after the christmas holidays. To achieve more interesting insights, the data is complemented with weather data through a JSON API. The project starts by considering research questions that would bring value to everyday...
Marcos Ivorra Peleguer
Project photo

Poverty rate analysis with linear regression and PCA

This notebook focuses on the analysis of the poverty rate of OECD countries in 2015. The analysis shows that income inequality explains the most of the poverty rate, but the share of this factor tends to change depending on the country.
Valentin Joly
Project photo

GPU Data Extraction

Scraped data on Amazon containing GPU Prices & preprocessed the data to use for data visualization & predictive modeling. Click on the 2nd link to see the article on Medium.
Huy Doan
Project photo

Fake News Classification

I use bagging and boosting ensemble methods and compare the results in classifying fake and real news articles.
Gareth Moen
Project photo

Artificial Neural Networks: Predicting Patient Outcomes

The goal is to understand the factors that lead to the survivability of patients who have experienced an acute myocardial infarction. Looking at a sample population of patients in the Massachusetts area, advanced data analysis will help gain some clarity on what affects their outcome.
Eric Haney
Project photo

Exploring the Impact of Covid-19 on Mental Health in Singapore using NLP

This project aims to uncover the impact of Covid-19 on mental health in Singapore, by collecting and analysing public sentiments in the ongoing Covid-19 outbreak. Insights and findings will be shared with mental health NGOs in Singapore, who can use the findings to make more informed decisions...
Manel BELHAJ
Project photo

Web Traffic Analysis and Forecasting

(Click on the link - Takes 1-2 minutes to completely load. ) Analyzed and predicted the future traffic for multiple time series of Wiki pages.
Avash
Project photo

Using co-word network community detection and LDA topic model to extract topics on TED Talks.

This project applies two automatic clustering (co-word network analysis with community detection & NLP techniques with LDA topic modeling) on 3 data columns (related tags, video description and transcript) to extract topics from TED Talks, and discerns whether more controlled vocabularies and...
Amber Hong
Project photo

Perspectives to the Future of Software Startups in the U.S.

This study aims to explore the ecosphere of the startups in the U.S. software industry and build a predictive model to foresee their future development. Several visualization graphs are presented to depict different aspects of the ecosphere; by interpreting the information revealed from which,...
Amber Hong
Project photo

Covid Dataset Exploratory Data Analysis

In this project I did some data exploration analysis Covid Data using SQL and Python. Then I used Tableau for further analysis and Data Visualization.
Soufiane DAHIMI
Project photo

Car Price Analysis

Car price analysis with python using various factors to see how price react to them
Daniel Osariemen Osazee
Project photo

Machine Learning: Regression project

As a final project for the second course of the ibm machine learning specialization, do a simple project on a linear regression applying different configurations and regularizations.
Vicente Figueroa
Project photo

Boston House Prices EDA

You are a Data Scientist with a housing agency in Boston MA, you have been given access to a previous dataset on housing prices derived from the U.S. Census Service to present insights to higher management. Based on your experience in Statistics, what information can you provide them to help...
Akriti Sood
Project photo

Airbus Ship Detection

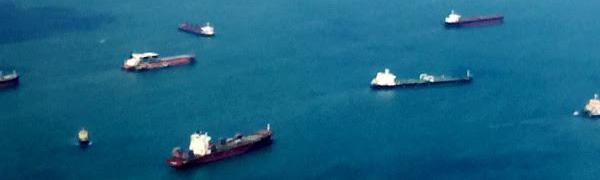
In this project, we aim to explore the application of deep learning techniques such as Convolutional Neural Networks (CNN), to highlight an innovative approach to automatic ship detection in the context of maritime domain awareness. The paper aims to provide a brief description of the problem,...
Jay Bendre
Previous page Next page