
My Stock Market Journey

Project links
Skills
About this project
My Stock Market Journey
Introduction
In this article, I showcase my investment journey, highlighting global events and strategy changes over time comparing growth in my account value to the stock prices, NASDAQ and S&P500 indexes. Over four years, I achieved an overall profit of 190% with a maximum of 200%.
Compared to 76% on NASDAQ and 74% on S&P500 during the same four years period, my profit was almost three times higher than the indexes.
This journey demonstrates my analytical skills, strategic thinking, and adaptability in the stock market.
Check out my analysis which included Python, SQL and interactive visualizations on Tableau, to clean, filter, highlight and compare value growth.
Initial Investment and Strategy
Without much prior knowledge of the stock market, I identified significant investment opportunities during the COVID-19 crisis. Living in Tabasco, Mexico, where 48.6% of the GDP comes from gas and oil, I observed a sharp decline in oil prices, leading to a drop in stock prices of oil companies.
The chart below shows the decline in oil prices and the stock prices of Halliburton (HAL) and Schlumberger (SLB), the companies I decided to invest in after the COVID-19 pandemic hit the US. The timing coincided with the historic drop in oil prices to negative values. This prompted me to open my trade account and invest in these stocks.

Data Analysis Techniques Used:
- Data Source: Historical stock and oil prices were downloaded from investing.com as CSV files.
- Data Cleaning and Transformation: Performed in Excel to prepare the data for analysis.
- Data Integration: Used BigQuery (SQL) to combine all data into one CSV file, adding notes about global events influencing these changes.
- Visualization: Transferred SQL code to Python for the final graph, allowing the addition of global event notes on the timeline. LINK TO CODE
Despite knowing it was a safe investment, I felt uncomfortable putting all my money into one industry. I also noticed that airline stocks were very low (-60%) due to pandemic restrictions, making them a good investment opportunity.
Portfolio Diversification
I divided my portfolio between two oil companies (HAL & SLB) and three airlines (DAL, AAL, & UAL) traded on NASDAQ. United Airlines (UAL) was introduced to the portfolio in July 2020. I held shares in these stocks for over three years.

Data Analysis Techniques Used:
- Data Source: Trade history CSV files from my account.
- Data Cleaning and Summarization: Conducted in Excel to display portfolio distribution on May 1, 2020.
The chart below shows the percentage increase in stock prices of oil and airline companies since I started trading, along with the amount of purchased and sold shares in my account.

Data Analysis Techniques Used:
- Data Source: Trade history CSV files from my account.
- Data Cleaning and Summarization: Conducted in Excel to display portfolio distribution changes.
- Visualization: Used Tableau to create dashboard charts showing the percentage increase in prices of oil and airline companies and the amount of purchased and sold shares over time. LINK INTERACTIVE VIZ
Strategy Evolution
Initially, I bought and sold shares without a clear strategy, reacting to short-term price movements. Observing the stock prices fluctuating daily, I developed a trading strategy (Fixed Investment Value Strategy) to profit from these changes systematically. I sold $500 worth of shares whenever I had $500 in earnings from the last trade and bought shares worth at least $500 when the stock decreased by $500. This method allowed me to maintain a consistent investment amount despite daily fluctuations.
My goal was to create a system for making buy and sell decisions without emotional interference. The chart below shows the stock price increases of HAL, SLB, DAL, UAL, and AAL since I started trading, with a dashed line representing the average and a red line showing the percentage increase in my account value after adopting this strategy.

Data Analysis Techniques Used:
- Data Source: Historical stock and oil prices from investing.com as CSV files & Equity CSV files from my account.
- Data Cleaning and Summarization: Excel.
- Data Integration & Visualization: Combined percentage increase of analyzed stock prices and account growth using Python to create a comparison over time from May 1, 2020 with global events. LINK TO CODE
Mistakes and Learnings
I made several mistakes, such as investing in industries without thorough research and continuing to invest in airline stocks despite their decline. These experiences taught me valuable lessons about the importance of research and the dangers of over-reliance on market timing.
Strategic Shift
After realizing that airline stocks had peaked and showed no signs of significant recovery, I sold all my airline and oil company stocks. I shifted my focus to investing in well-known tech companies with strong financial stability. I used EPS (Earnings per Share) growth calculations and analyzed quarterly reports to identify fair stock prices for long-term investments.

Data Analysis Techniques Used:
- Portfolio Analysis & Visualization: Created in Excel using CSV files of my current account position.
Conclusion
Overall, my strategy during the first three years performed comparably to an evenly distributed portfolio among the five stocks. However, my revised strategy in the last year resulted in a 33% better performance.
The chart below shows the global events, strategies and percentage growth of my account during those 4 years.
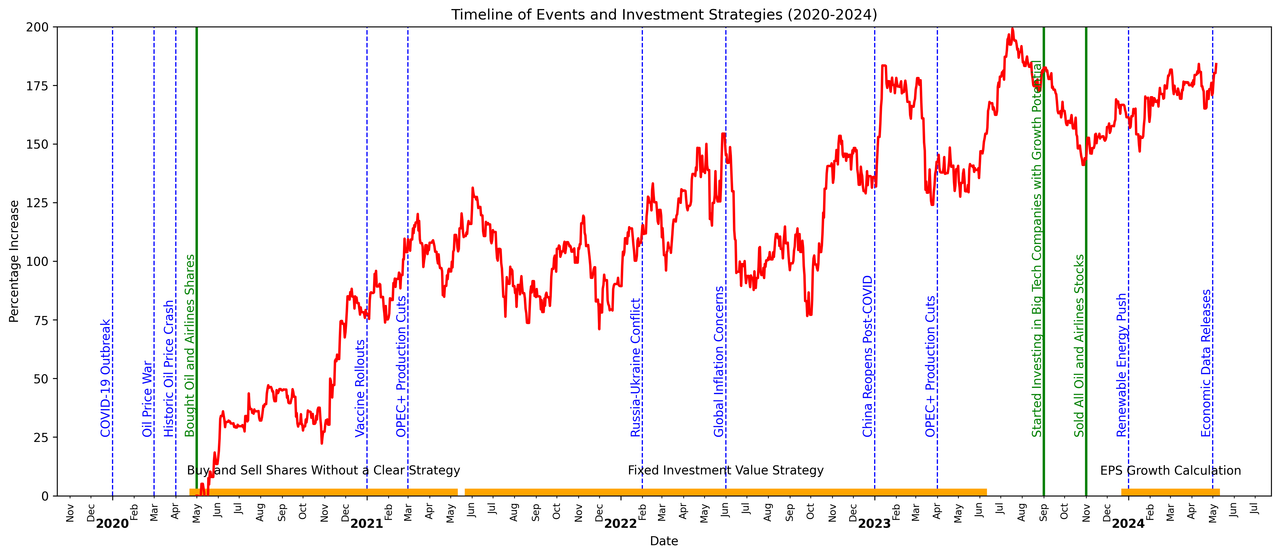
Data Analysis Techniques Used:
- Data Source: Trade history & equity CSV files from my account.
- Data Cleaning and Summarization: Conducted in Excel to display portfolio distribution changes.
- Data Integration & Visualization: Used Python to illustrate the percentage increase in my trade account value, adding global events and used strategies on the timeline. LINK TO CODE
The chart below shows a comparison between my account growth, S&P500 & NASDAQ indexes of those 4 years.

Data Analysis Techniques Used:
- Data Source: Equity, S&P500 and NASDAQ history data on CSV files from my account and investing.com.
- Data Integration: Conducted in Tableau creating connections between these files.
- Visualization: Used Tableau to create dashboard charts showing a comparison between the percentage increase in those indexes and my account for 4 years. LINK TO INTERACTIVE VIZ
Over four years, I achieved an overall profit of 200%, with 65% of it occurring in the first year. Compared to 76% on NASDAQ and 74% on S&P500 during the same four years period, my profit was almost three times higher than the indexes.
This journey demonstrates my ability to adapt, learn from mistakes, and develop data-driven investment strategies. These skills are directly applicable to data analysis roles in fintech companies.